¶ Questions Analysis
This two-level report will analyse your Interactive Assignments Questions average earned points based on your students submissions, This will help you to understand which of your Interactive Assignment questions was a big challenge to most of your students.
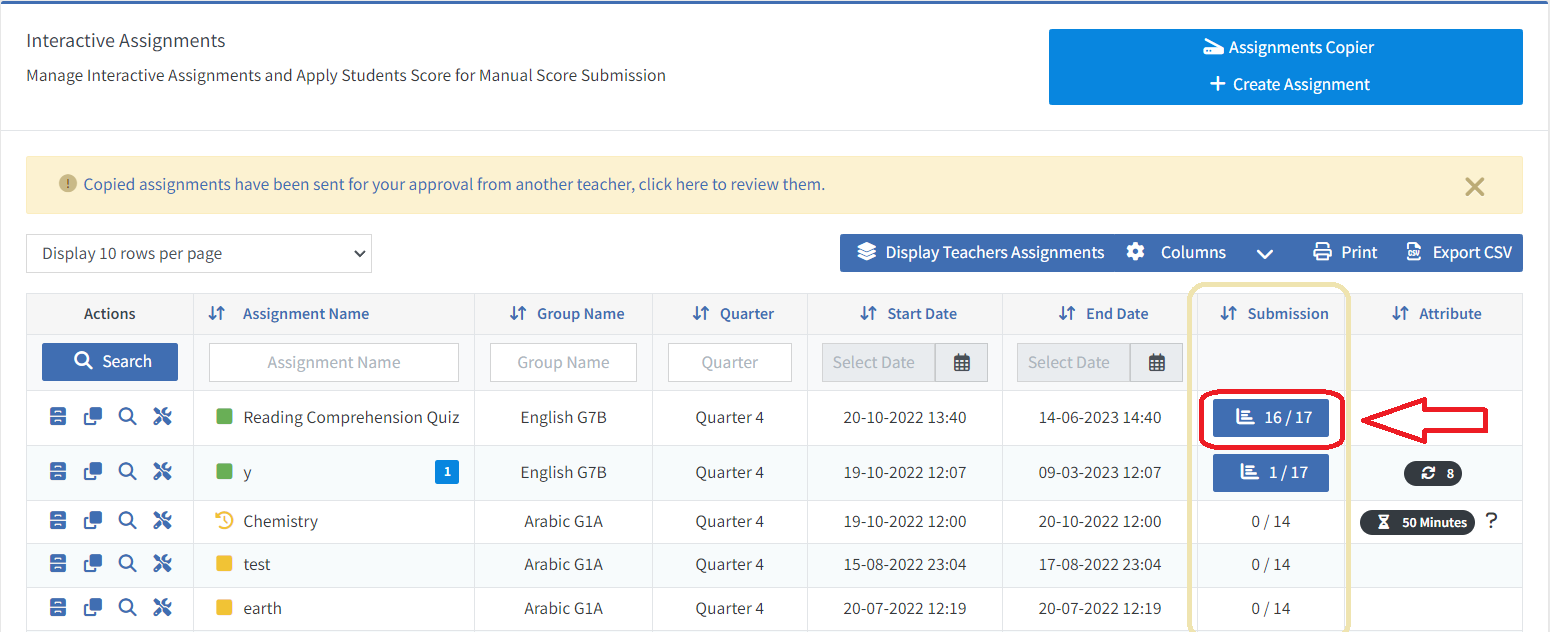
Once your students have submitted on certain Interactive Assignment, there will be show a button in Submission column in Interactive Assignments List.
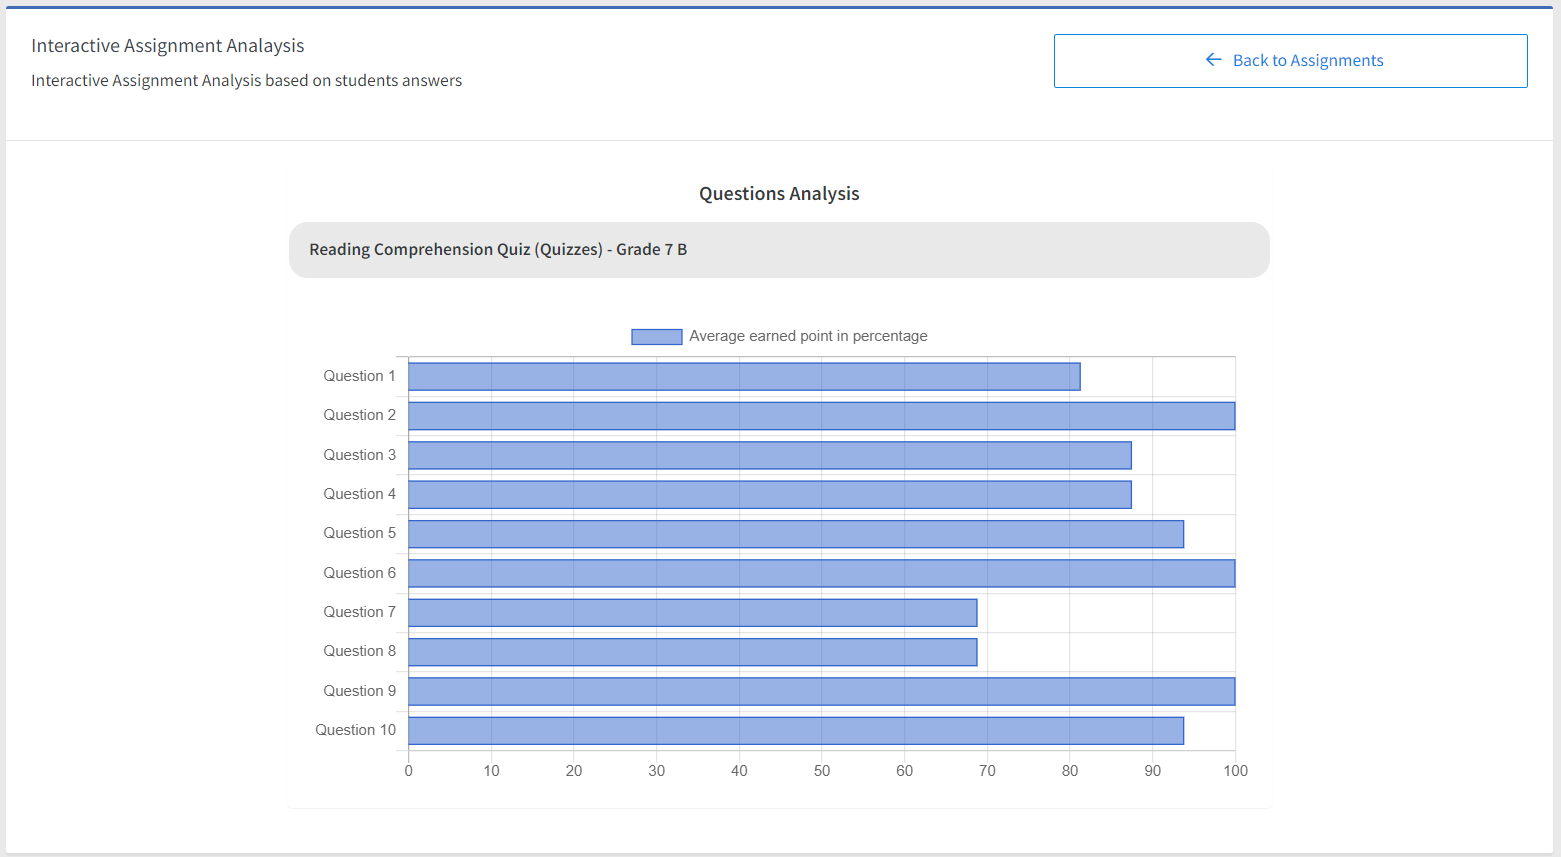
Once you click on “Questions Analysis” from your preferred Interactive Assignment, you will get all of this Interactive Assignment’s Questions displayed in bar charts with average of the earned points in percentage.
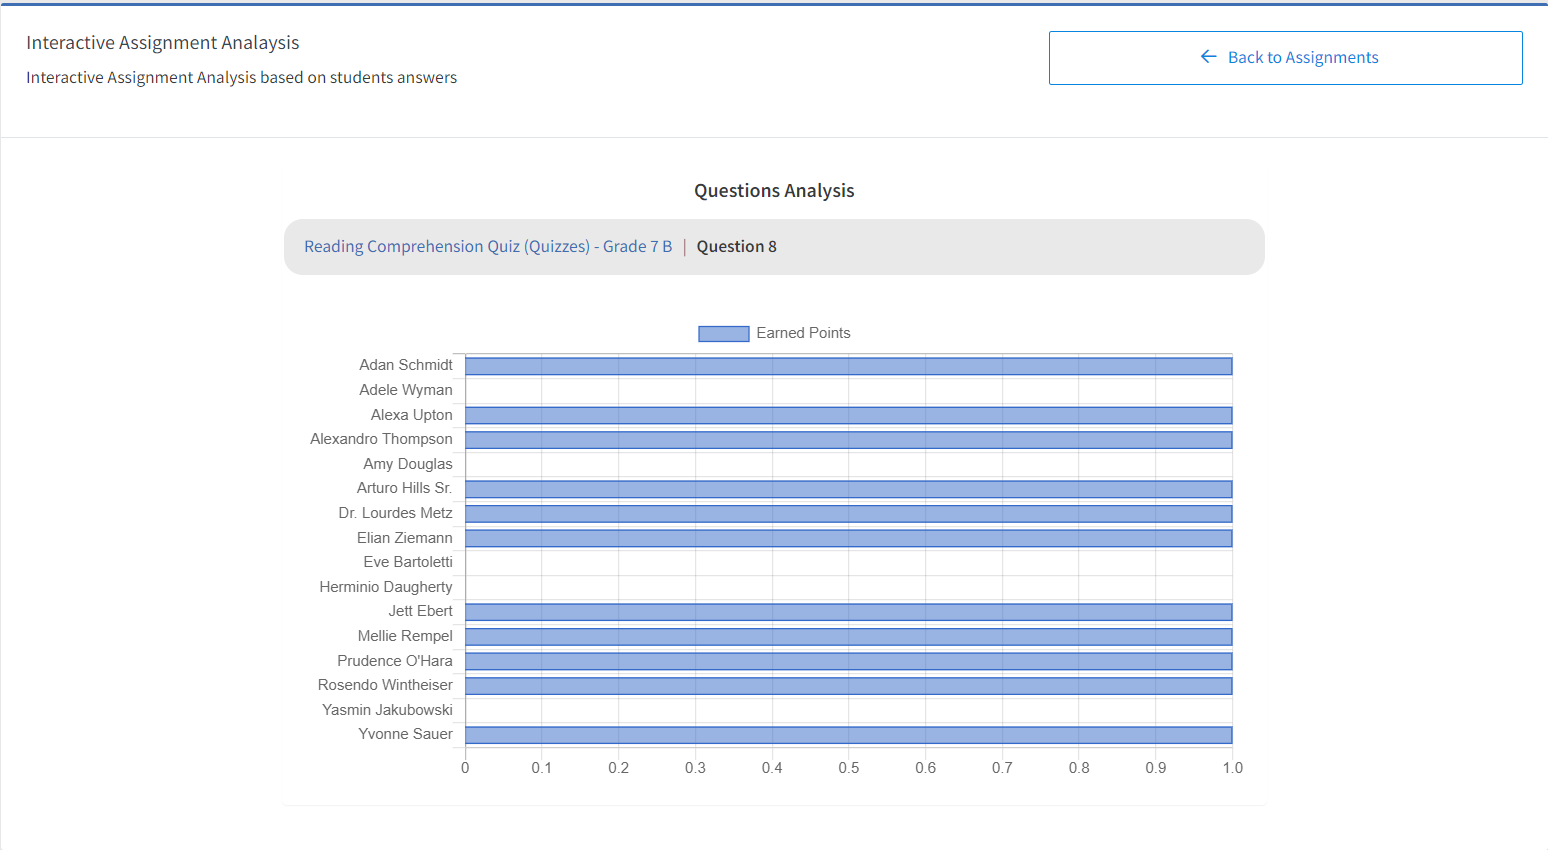
If there is a specific question you want to know which of your students scored the least on it, click on the question number, and all of your students earned points per the selected question will be displayed.